
 0
0
 0
0
By Larry Gray
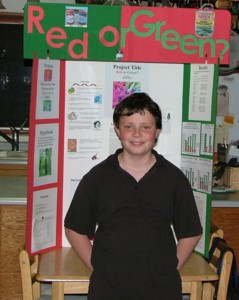 Editor’s Note: Larry is a 12-year-old student (in 2008) at Route 66 Elementary School in Edgewood, New Mexico. His favorite food is shredded beef burritos smothered in green chile, and he got this idea for a fifth grade science fair project when he was asked “Red or Green?” while ordering in a local New Mexican restaurant. He was assisted in a large project like this by his parents Lorilee and Lawrence Gray. His other interests are video games like “God of War,” riding his ATV, and his pet bearded dragon lizard Rocky. His teacher is Jill Stewart, who is–coincidentally and ironically–the ex-wife of Robert Spiegel, the founding publisher of Chile Pepper magazine in 1987. Except for some minor editing to make this study publishable in this format, the words that follow are those of Larry. Full disclosure: I am paying Larry for the right to publish this study, so he is now a published author. Also note that in 1999 the New Mexico State Legislature enacted a memorial making “Red or Green?” the official New Mexico State Question. –Dave DeWitt
Hypothesis
If other people like the mild and flavorful taste of green chile like I do, then more New Mexicans will prefer green chile to red chile.

Method of Procedure
First, I decided to survey restaurants to see what their opinion was on the Red or Green question. My dad and I made a survey form to include the restaurant name, their address, their phone number, the name of the person contacted, and the percentage of red or green chile they serve. We looked in the Yellow Pages and randomly selected 15 restaurants as this seemed like a reasonable amount. We made the telephone calls and recorded the information on the survey form.
Second, I did the same thing for Mexican Food distributors as I did for the restaurants but as there aren’t that many of them, only 5 were selected and recorded on the form.
Last, we made a form to survey New Mexicans on which they preferred but this time with the persons name, age, sex and what they preferred–red or green–on the form. The age and sex were included to see if age or sex was a factor in what they preferred. To get a good amount of opinions but still spend a reasonable amount of time we decided to survey 100 people. We wanted an equal amount of males and females, so 50 of each sex were selected and we tried to get a mixture of males and females in each of the 5 age groups. The age groups were decided by looking at other surveys we could find. The age groups decided on were under 18, 18 to 29, 30 to 44, 45 to 59 and 60 and over.
At home I had my mother and sister take the survey and recorded the information on the survey form. Then I took the survey to my school Route 66 Elementary in Edgewood and asked some of my classmates for their choice and recorded the information on the form. My dad took the survey to work at Corporate Express in Albuquerque and asked some of the people he works with for their choice and we recorded the information when he got home. Last we took the survey to Smiths grocery in Edgewood, and with the store manager’s permission we stood outside the store and asked people as they came into the store to take the survey. It took two visits and about 4 hours to get the other 81 opinions we needed to get to 100, and they were also recorded on the form.
As there weren’t really any major safety issues on this experiment, no precautions were necessary except for an adult to be with me and to get the store managers permission to do the survey on their property. We were very polite in approaching people and asking if they would take the survey and that it was for a school science project. Not one person said no and many seemed very excited to do it and wanted to know more about the project. Several people did say they liked both equally but since the survey question was which “one” do you prefer, we asked them if they could only have one which one would it be. They all chose green. Several others didn’t like chile at all and were not surveyed. A few more were from out of state so we did not survey them as the purpose question was specifically what do New Mexicans prefer.
We then recorded the choices on graphs to easily display the choices. Graphs for the Restaurants and Food Distributors were made to show just red and green. For the people survey, we broke it down in many ways to try and see if it showed a pattern. We made graphs for the all100 people surveyed, by age group, by sex, by age group female and by age group male.
Results
More New Mexicans preferred green chile than red chile.
Restaurants: 59.33% green to 40.67% red
Mexican Food Distributors: 67.00% green to 33.00% red
Survey All 100 people: 75.00% green to 25.00% red
Results Graphically
 |
 |
 |
 |
 |
Conclusion
My data did support my hypothesis. More New Mexicans do prefer green chile to red chile. In fact a lot more prefer green chile. To make my hypothesis more accurate it could have been to ask more people in the Edgewood area which they preferred, red or green?
I discovered that outside of New Mexico most people never eat green chile and that in most foreign countries, especially, Europe they have never even heard of it. I think the green chile percentage was higher in the Edgewood area then it might have been in other parts of the state that are closer to the borders of Colorado, Texas or Arizona. Those states are known to eat more red chile sauce or enchilada sauce that is made with red chile. Another survey near those areas would be needed to confirm that.
The food distributors and restaurants green chile percentages were still higher than the red chile percentages but were much lower than the 100 people surveyed green chile percentage. The reason for this is that the food distributors also ship their products outside of New Mexico to areas where only red chile is served. The restaurants serve many tourists and travelers from other states that are more familiar with red chile so they order that when they eat here as well which raised the red percentage. The Restaurant survey is also probably the least accurate as it was only one person guessing how much of each chile they serve. The restaurants did not have records of this like the food distributors do.
I expected to find that the percentage of men and women that like green chile would be about the same and that was true. I was surprised to find that as people get older the percentage that like green was the highest of all and by the time they reach 60 almost none seemed to eat red. This seems to be because the older people I surveyed thought that red chile is often spicier then green and older people have a hard time eating spicy foods.
A couple of the most interesting things I found out were that red chile is just the ripened version of green and not another plant, and that I would not be able to get a green chile cheeseburger at McDonalds in another state. I really enjoyed doing this experiment because of the time I spent with my dad working on it and meeting lots of people doing the survey.
Bibliography
Internet:
Fiery Foods www.fiery-foods.com
Hatch Chile Festival www.hatchchilefest.com
Bueno Foods www.buenofoods.com
State of NM Question www.sos.statenm.us/kidscorner.com
Dave DeWitt Information www.cahe.nmsu.edu/anadeies.com
Books:
The Chile Pepper Encyclopedia by Dave DeWitt April 01, 1999. Publisher William Morrow & Company
The Whole Chile Pepper Book by Dave DeWitt and Nancy Gerlach. Publisher Little, Brown & Co.
Expert opinions and advice:
Dave DeWitt. Author and Publisher
Lisa. MacDonald’s General Offices/LGG Enterprises
Arian Gonzales. Manager of Cervantes Food Products
Acknowledgments
Mr. Lawrence Paul Gray (Dad)
Mrs. Lorilee Gray (Mom)
Miss Rachael Lee Gray (Sister)
Mrs. Jill Stewart (Teacher)
Mr. Dave DeWitt (Author, Publisher)
The People of the Edgewood and Moriarty Area for taking the survey
The Restaurants and Food Distributors for taking the survey
Smiths Grocery Edgewood (Survey site)
Route 66 Elementary School (Survey site)
Corporate Express (Survey site)
Additional Stats
Female by Age:
Under 18: 44.44% green to 55.56% red
18 to 29: 83.33% green to 16.67% red
30 to 44: 76.92% green to 23.08% red
45 to 59: 100.00% green to 0.00% red
60 and over: 80.00% green to 20.00% red
Male by Age:
Under 18: 62.50% green to 37.50% red
18 to 29: 60.00% green to 40.00% red
30 to 44: 80.00% green to 20.00% red
45 to 59: 77.78% green to 22.22% red
60 and over: 100.00% green to 0.00% red
00